
The new territory of a fixed-term parliament means Labour should hold its nerve as 2015 draws near, writes Lewis Baston
In years gone by, the fourth party conference season of a parliament would have been heavy with speculation about the timing of the next election. Even if the parliament ran into a fifth year, all the parties would have to prepare for an election in 2014 just in case. The Fixed Term Parliaments Act 2011 has changed all this, and this year’s conference season takes place with a five-year parliament confidently expected.
There are valid doubts as to whether fixed-term parliaments will make much difference in the long term. At least rhetorically, oppositions always want an early election, and it would be politically impossible not to vote for a dissolution of parliament if a future prime minister wanted to call an election as Margaret Thatcher did in 1987 and Tony Blair did in 2001. But the fact that there is a coalition agreement for a five-year stretch should mean that this parliament should go to term. It has worked to a different, slower timetable than we are used to, but even so the general election is starting to come into focus.
Labour’s polling performance has been steady but not spectacular. In his pamphlet for Progress earlier this year, Majority Rules, Peter Kellner drew attention to the historical pattern that oppositions that go on to win the subsequent general election have enjoyed 20-point leads at some point in opinion polls, and those that did not tend to fail. The exceptions to the generalisation are Labour in 1987-92 and the Conservatives in 1950-51. Labour in 2010-13 has never reached a 20-point lead, although in 2012 the party did reach the mid-teens.
However, looking at a party’s maximum lead is not the only way of learning from polling history. We can look at what the position was at around this stage in previous parliaments. May 2013, three years after the general election, is therefore month 36, and September is month 40. How does Labour’s performance now compare with past oppositions, successful and unsuccessful?
The first chart (right) shows the percentage point lead in opinion polls for the main opposition party over the
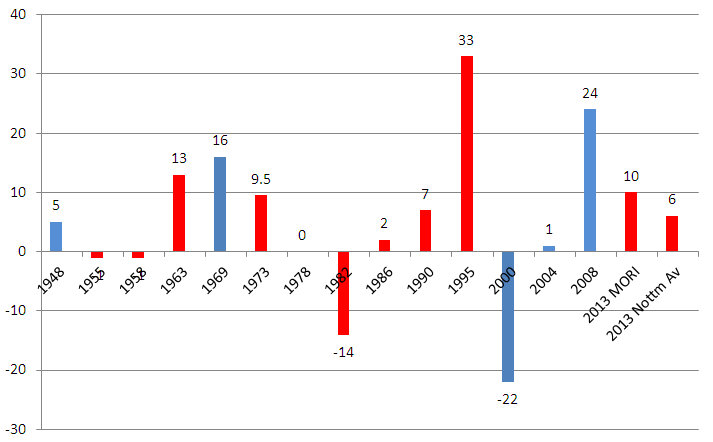
Source: Opinion poll series in Rallings & Thrasher British Electoral Facts p261; Gallup data 1945-79, MORI/Ipsos MORI since 1979. Second column for 2013 is the Nottingham University Polling Observatory’s August 2013 average reported at http://nottspolitics.org/2013/09/05/polling-observatory-28-too-early-to-telloutside-the-westminster-bubble/)
main government party in the 39th month of each parliament since 1945, ie each parliament’s equivalent of August 2013.
Labour is now more or less where it was under Harold Wilson in 1973 and Neil Kinnock in 1990, but the observation is not very helpful given that the two biggest leads for an opposition, in 1995 and 2008, led respectively to a landslide win and a hung parliament. Taking one month’s readings can be affected by fluctuations, particularly in past parliaments when fewer polls were conducted. We can look instead at the broader trends in the late midterm of past parliaments for a better clue.
In the second chart opposite, the extremely good opposition performance in 1992-97 and the extremely bad opposition performance in 1997-2001 are both omitted.
It does not take sophisticated statistical knowledge to see that Labour’s current position looks more like the
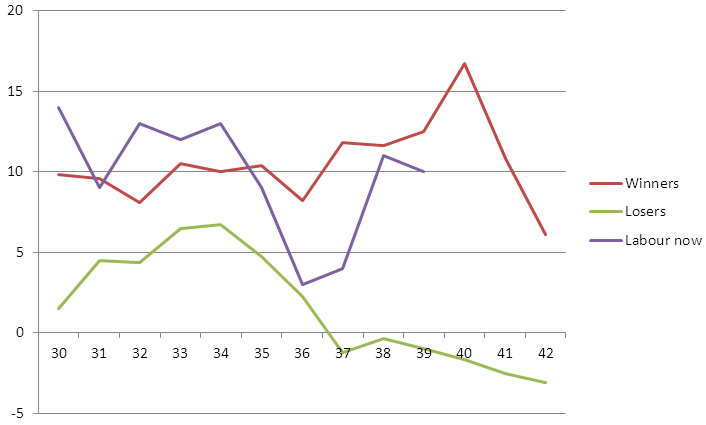
Winners: 1959-64, 1966-70, 1970-74, 1974-79, 2005-10
Losers: 1951-55, 1955-59, 1979-83, 1983-87, 1987-92, 2001-05
The extremely good opposition performance in 1992-97 and the extremely bad opposition performance in 1997-2001 are both omitted. Source: pre-1979 Gallup, 1979- MORI as tabulated in British Electoral Facts and www.ipsos-mori.com for post-2006 data.
average winner than the average loser. It is pretty typical for a party that is going to win a modest-sized victory, such as Labour in 1959-64 and 1970-74, and the Conservatives in 1974-79. The chart also suggests that Labour should hold its nerve if the advantage erodes a little further, but perhaps get seriously worried if it vanishes. The only time an opposition party has had leads of anywhere near this level at this stage in the parliament and then lost was 1987-92, and that was with the help of a change of prime minister, and of key policies (the poll tax) and the whole style of government. Nothing similar can be expected in 2010-15.
The five-year term means that the past is even more limited than usual as a guide to the present and the future; the cycle is different from the formerly standard four-year term. In the past, there was a causal link between an opposition that was failing to convince at this stage and the coming of an early election. Prime ministers such as Anthony Eden, Harold Macmillan, Thatcher and Blair banked their advantage with elections at around the four-year mark, and James Callaghan should have done. The fifth year was to be avoided if possible because of the uncertainty and the likelihood that it would be dominated by electioneering rather than governing. High opposition ratings in midterm caused five-year terms, but this time parliament will go to five years anyway.
The classic pattern of public opinion in a parliament – government honeymoon, midterm discontent, government recovery in the run-up to a general election – happens less often than one might believe. The 1992-97 government had 57 months of midterm blues, while the 1997-2001 government had two weeks in September 2000. The Labour government of 2001-05 had a very mild midterm dip, but then did not have much of a pre-election recovery either. The parliaments of 1974-79 and 2005-10 saw several wild swings of opinion, with massive leads for the opposition coming and going more than once. It would have been quite possible for the Conservatives under Thatcher to have panicked on more than one occasion – when Callaghan replaced Wilson in April 1976, and in autumn 1977 and autumn 1978 when Labour had poll recoveries on the basis of better economic news. But the Conservatives’ nerve held.
Looking at the historical record also helps us identify some of the problems Labour is going to face in the next couple of years. Parties of government have quite often used the conference season to change the political weather, set the terms of debate for the next year and announce attractive new policies. The conference season helped governments regain control in 1969 and 1986 in particular. Conferences are less of a big deal to the media than they used to be, but the coalition parties have opportunities that past governments have not enjoyed. They can both set out new policies and claim that being in coalition has prevented them being implemented in 2010-15, while Labour still has to cope with the perennial first-term opposition question of ‘If that’s such a great idea, why didn’t you do it while you were in power?’
The other problem is perceptions of the economy. A curious pattern in polling history is that some elections 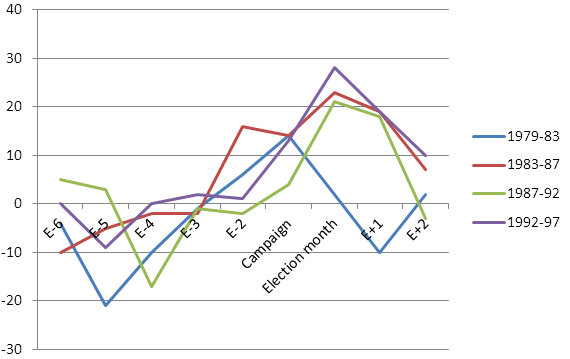 are associated with shortlived spikes in economic optimism. It happens when the Conservatives are in power, but not noticeably under Labour, raising the possibility that Tory governments and their supportive media (against the background of credit-fuelled consumption spending) can create bounces in economic optimism on the scale of about 30 points, but not for long.
Labour should expect, despite the extremely poor economic performance of the coalition, that the 2015 election will be fought on an illusory battlefield in which the coalition claims to have ‘sorted out’ the ‘mess’ it inherited, but has postponed the bad news until after the election. The question then becomes whether Labour should accept this framing, and argue about priorities in a growing economy (as in 1997) or attempt to puncture economic optimism, as the Conservatives did successfully in their surprise victory of 1970, and Labour did to some extent in 1964.
Labour’s current position in voting intention is certainly consistent with winning in 2015, but trends in past parliaments are less of a guide than before because of coalition and a five-year parliament. Steady nerves, clever leadership, message discipline and some easily summarised popular policies are all required in this uncharted late midterm phase of Labour in opposition.
———————————————————
Lewis Baston is senior research fellow at Democratic Audit and a contributing editor to Progress
———————————————————